The current source text is the original text and can be switched to the Chinese translation.
SaveShare
报道配图 · 来源:LessWrong
Overview
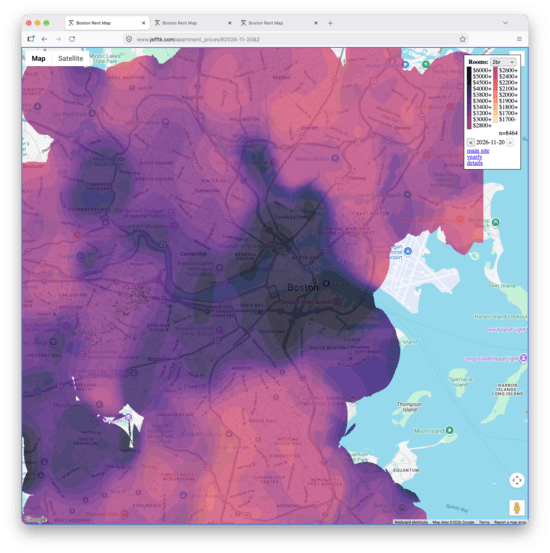
I maintain a Boston rent map . I'm not much of a data scientist, but over the last fifteen years I've written really quite a lot of blog posts on this dataset . Housing is such a huge part of where people's money goes, and it's a really interesting window into how Boston has changed over time. Still, the map has been kind of janky in a bunch of ways: it computed distance in lat-lng space and so weighted north-south higher than east-west, didn't make intelligent use of history, didn't do holdouts correctly, and used a hacky " affine + correction factor " model, among other things. I had Opus 5.5 take a go at cleaning it up, and it's a lot better. The big things: It found a bug where I had been calculating the legend wrong for years. For example, for 2026-11 this made studios show up as 26% cheaper than they should have, and 3br units 12% too expensive. Since desirability typically doesn't change quickly, it can combine data across months to make better predictions. This also means we can count each listing only when it first appears: otherwise when overpriced stick around they push modeled prices up. It gives finer detail in areas with more listings, and handles big buildings sensibly. Several new map views, including inflation adjustment , comparisons across time, and comparisons across space. A trends page, which has automatically-updated versions of the numbers I used to run in some of my "let's look at this data" blog posts. It uses Census data to skip places no one lives, instead of claiming rents for the airport or middle of the Charles. It also runs 270x faster (16s for a month instead of 72min). Before: After: Give it a try: interactive map . Comment via: facebook , mastodon Discuss
I maintain a Boston rent map . I'm not much of a data scientist, but over the last fifteen years I've written really quite a lot of blog posts on this dataset . Housing is such a huge part of where people's money goes, and it's a really interesting window into how Boston has changed over time.
Still, the map has been kind of janky in a bunch of ways: it computed distance in lat-lng space and so weighted north-south higher than east-west, didn't make intelligent use of history, didn't do holdouts correctly, and used a hacky " affine + correction factor " model, among other things. I had Opus 5.5 take a go at cleaning it up, and it's a lot better. The big things:
It found a bug where I had been calculating the legend wrong for years. For example, for 2026-11 this made studios show up as 26% cheaper than they should have, and 3br units 12% too expensive.
Since desirability typically doesn't change quickly, it can combine data across months to make better predictions. This also means we can count each listing only when it first appears: otherwise when overpriced stick around they push modeled prices up.
It gives finer detail in areas with more listings, and handles big buildings sensibly.
Several new map views, including inflation adjustment , comparisons across time, and comparisons across space.
A trends page, which has automatically-updated versions of the numbers I used to run in some of my "let's look at this data" blog posts.
It uses Census data to skip places no one lives, instead of claiming rents for the airport or middle of the Charles.
It also runs 270x faster (16s for a month instead of 72min).
READ THE ORIGINAL
Read the original for the full context.
The content of this article comes from LessWrong,Copyright belongs to the original author and publisher.
Tl;dr : Intuitions we have about human organisations, like how we think of making deals or how we think about the power or values of an organisation, can be productively applied to understand groups of AIs taking coordinated action in the world. An important consideration in understanding the type of AI organisations we expect is which notion of self AIs will adopt.
Business or Consumer? Everyone you sell your product or service to is a customer. However, the question is: do you treat them as a business or a consumer? You might think that’s a pointless distinction since your goal is simply to sell your product, right? Wrong. That question determines your product’s market fit.
The Ban RSI protest at Anthropic’s IPO was encouraging: well-attended, covered by media, high-energy. It was focused on a single message – that we should ban AI systems that are capable of building more capable AI systems. It was a promising outcome for a protest planned only a couple of days in advance. But there was something weird about it, something I couldn’t put my finger on while it was going on.

Loading comments…